Simultaneous EEG MRI
MR-Compatible HD EEG
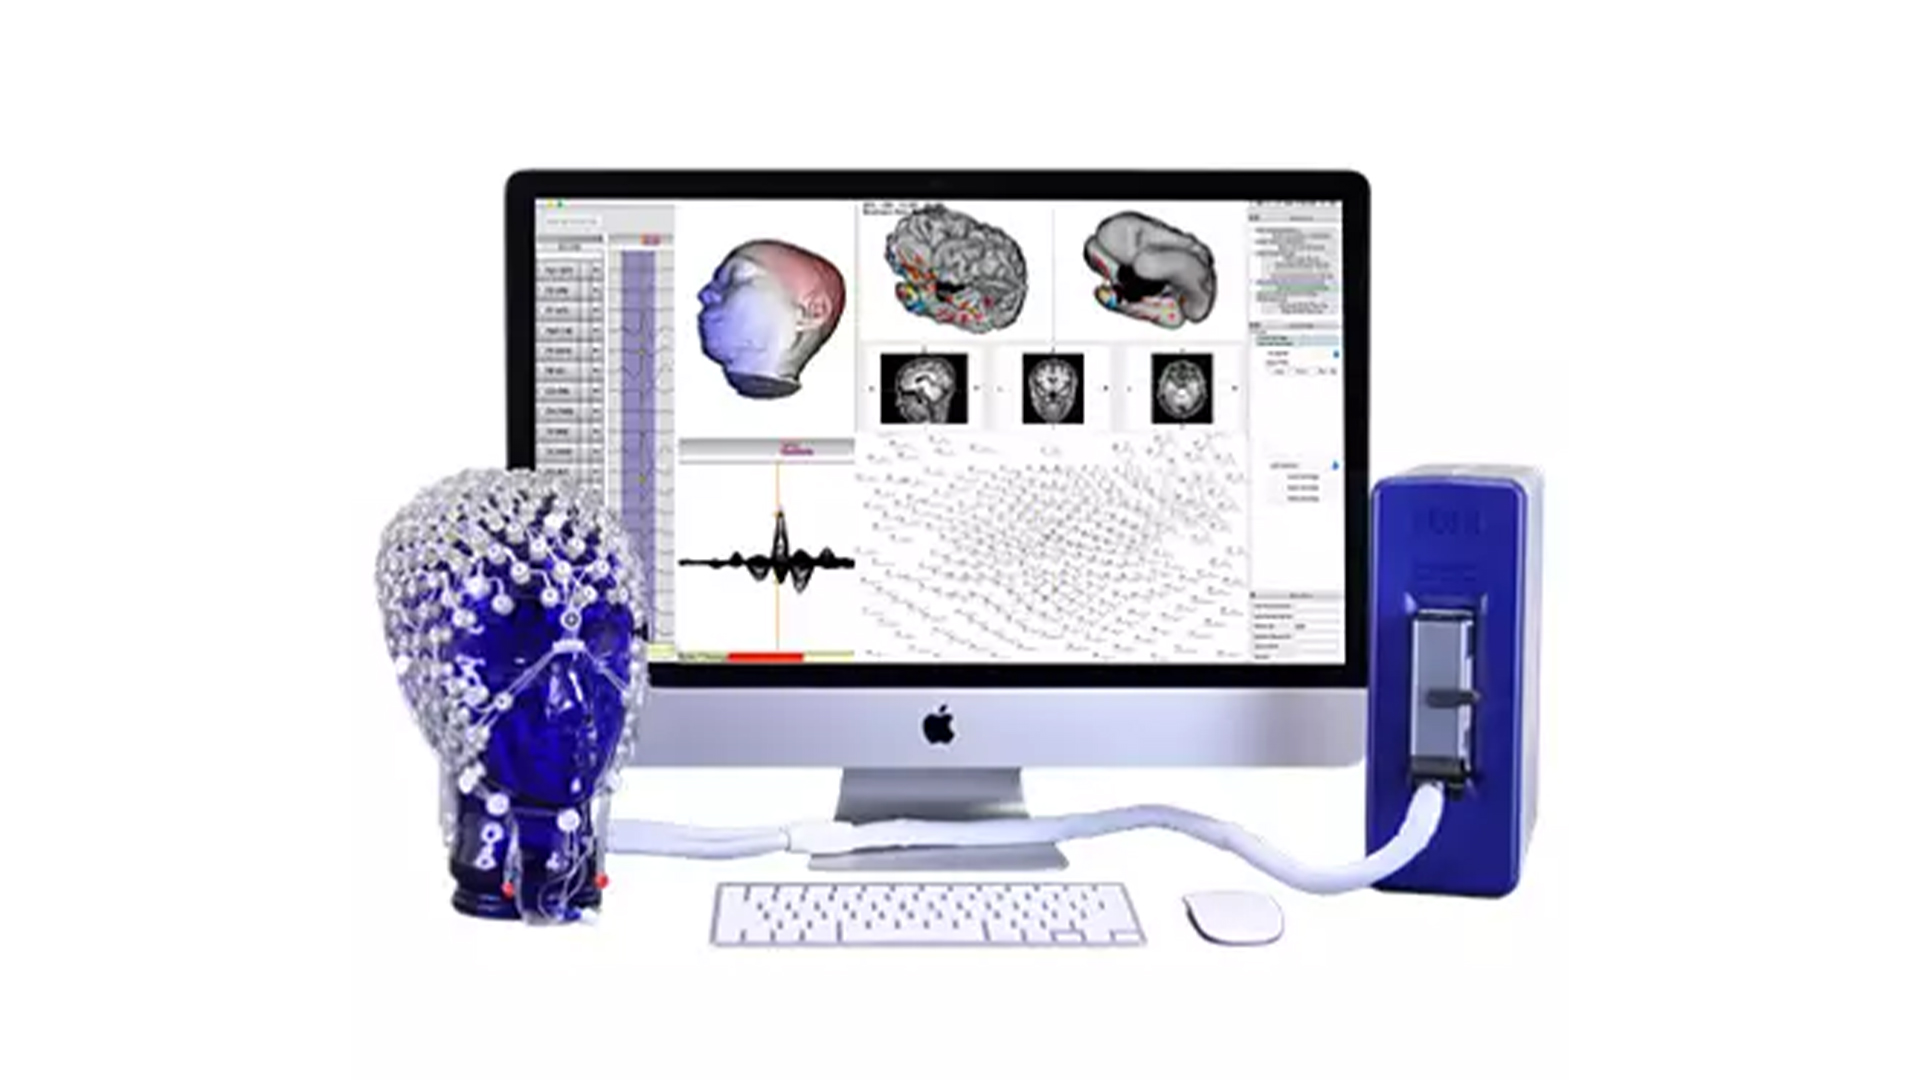
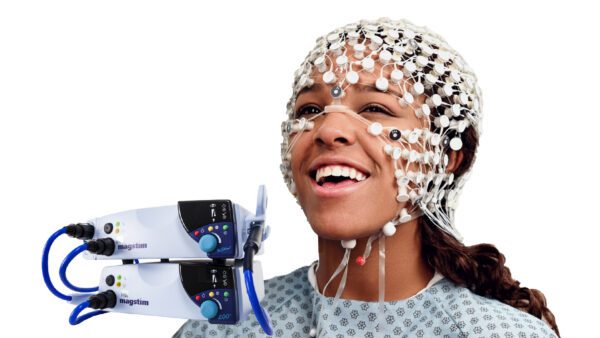
High Density EEG (64, 128 and 256 channels) can now be easily recorded in the MRI environment with good signal quality (for both EEG and MR data). Designed, tested and labeled for 3 Tesla (3T) MR Conditional Use.
Specifications
- Versitility. Use your GES MR in the MR environment or in the lab. There is no need for separate systems.
- Reduced noise. The Field Isolation Containment System (FICS) features shielding and input filtering that significantly reduce the effect of noise sources in the MR environment.
- Artifact removal. The GES MR system software corrects the EEG file for MR gradient, RF pulse, and ballistocardiogram artifacts.
- Channel counts. EGI’s fMRI compatible EEG systems are available with 32, 64, 128, or 256 channels.
Upgradeable channel counts. MR-compatible GES 400 systems are upgradeable by channel count so you can work with the full power of dense array EEG when you are ready.
With careful design for both safety and signal quality, EGI’s MR-compatible HD EEG system allows you to maximize your time in the MRI by minimizing setup time (around 10 minutes), ensuring superior comfort thanks to the high density sensor net distributing pressure evenly across the head compared to low-density EEG systems.
Two-way isolation (of the Net Amps 400 from the MR fields and the MR from the Net Amps 400 fields) is provided by the Field Isolation Containment System (FICS).
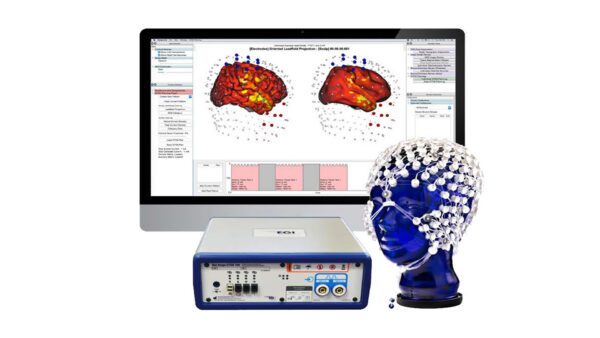
Systems are sold as complete packages with everything you will need to start work immediately. You can choose from either stationary or portable configurations, which can include:
- Net Amps amplifier
- hospital grade isolation transformer
- iMac or MacBook Pro computer
- Field Isolation Containment System (FICS)
- with
- GES Clock Sync I/O
- Electronic system manuals
- installation and basic training
- 1 year amplifier warranty
If you already own a Geodesic EEG System, you may upgrade your system for use in an MR environment with the fMRI Upgrade Package, which includes:
- Field Isolation Containment System (FICS). This enclosure for the FICS-compatible Net Amps 400 amplifier includes input RF filters, 2 fiber optic channels, and a battery power pack.
- for Net Station software
GES Clock Sync I/O
- installation and basic training
Precise registration of the High Density EEG (HD EEG) sensor coordinates with structural MRI, either an atlas or an individual’s MRI, provides an accurate head model geometry for electrical source estimation. With 128 or 256 channels, the HD EEG recording with the Geodesic Sensor Net provides sufficient sampling of the head surface potentials to allow estimation of the neural activity that gives rise to the EEG with the GeoSource software.
Most researchers continue to compute conventional referenced (e.g., mastoid referenced) EEG and ERP signals at the scalp so that they can compare results directly with earlier studies. However, the exciting new work is to examine the neural sources of the significant experimental effects.
Statistical analysis with HD EEG source measures provides convergent validation of the reliability of the source measures. Analysis in source space yields a new window on the temporal dynamics of human neurophysiology. See Luu, et al. (2010).
EGI’s GeoSource software integrates well-known distributed source estimation methods (LORETA, LAURA) with a high-resolution finite-difference method model of the head that is registered with the Montreal Neurological Institute average MRI atlas. Even when structural MRI is not available for the individual participant, the HD EEG (64, 128, or 256-channel) laboratory gains the advantage of MR registration with the atlas-based framework of GeoSource. See Kuo, et al. (2014).
With continued advances in MR-registered EEG, including constraining distributed sources to be normal to the cortical surface, there will be increasing advantages for HD EEG studies to link source analysis to head models built from the participant’s own structural MRI.
The temporal resolution of EEG is well known to researchers and clinicians; EEG directly measures neuronal activity. On the other hand, it is commonly believed that EEG provides poor spatial detail, due to the fact the EEG signal is recorded at a distance from the source generator, the signals are “distorted” by the inhomogeneous conductivity properties of different head tissues, and the ill-posed nature of the source-estimate inverse problem.
However, given advances in dense-array EEG recordings, image processing, computational power, and inverse techniques, it is time to re-evaluate this common assumption of spatial resolution. The EGI Science Team has been at the forefront of developments in dense-array EEG technology, MR image segmentation, and big-compute solutions that enable us to address the current, practical spatial resolution of dense-array EEG for neuroimaging.
Imaging Artifacts
Template Subtraction in Net Station software — During each head volume acquisition, both the gradient switching and radio frequency pulse pattern will produce strong artifacts that will obscure the EEG. However, the repetition time (TR) chosen for a particular scan protocol will provide this artifact with a specific temporal pattern.
Although imaging artifacts initially render the EEG completely unreadable, they do have characteristics that make them ideal targets for artifact correction. The gradient switching and radio frequency pulses occur within nanoseconds of each other across each volume acquisition, thereby creating a consistent artifact waveform profile with respect to each TR. As the MRI scanner sends a TR trigger to the EEG file, there is a clear method of identifying the onset and profile of the artifact. This promotes a relatively straightforward method of artifact correction — calculate an average of the imaging artifact waveform and subtract it from the simultaneously recorded EEG. The procedure is built into Net Station software and can be implemented either online or offline.
GES Clock Sync I/O — Since the EEG acquisition and MRI scanner use separate computers, their clocks are independent. In addition, the MRI scanner itself has a very high amplitude and rapid slew rate. Therefore, tiny amounts of jitter between the two clocks will result in the imaging artifact profile varying from one volume to the next. As this inconsistency reduces the efficacy of the average artifact subtraction method, it is not uncommon for additional steps to be introduced to the data cleaning workflow, such as signal interpolation and adaptive noise cancellation.
These limitations have led us to take a novel approach. We have created a situation where the EEG acquisition is effectively running the on the MRI system’s clock. This is done by introducing a phase-locked loop between the MRI and EEG system, which results in the jitter between the two clocks being reduced to a negligible amount (5-10 nanoseconds). In another example of how we closely work with our customers when developing our new products, we are licensing this synchronization technique from Dr. Mark Cohen from UCLA’s David Geffen School of Medicine. It is covered by US Patent No. 7,286,871.
Front-end filters within our FICS unit decrease the amplitude of the artifact prior to signal digitization. By the skillful combination of these two techniques we are then able to effectively remove the imaging artifact using the simple average artifact subtraction method.
Every time the heart beats, the resultant micromovement and blood flow of the head causes this periodic artifact.
Balistocardiogram (BCG) artifacts are difficult to handle and remove for several reasons: 1) within each electrode, their amplitudes and duration vary between successive heartbeats, 2) between electrodes their amplitudes and pattern vary, 3) their energy distribution overlaps with the frequency of the EEG, and 4) they share similar morphology with certain EEG phenomena. There are a handful of techniques that have been proposed for handling BCG artifacts (see Groiller et al., 2007) and we currently recommend the technique of Niazy et al. (2005), implemented in the FMRIB EEGLAB plug-in. We have implemented this method within Net Station software to optimize workflow.
In Net Station 5.2 and later, the MR-compatible GES 400 systems include a new EEG-based method for detecting the pulse artifact (PA) with significant benefits over the standard ECG-based methods, based on Iannotti, et al. (2015). The method uses the anti-symmetric scalp voltage potential topography of the pulse artifact, captured by the EEG, to identify the artifacts. At least as accurate as ECG-based methods, and often more so, the EEG-based method can replace ECG-based methods, being especially useful in cases where it is difficult to obtain clean ECG data, and can also complement ECG-based artifact detection as a secondary measurement.
Location of peak motor-related activity for fMRI (black star) and event-related spectral changes (high-gamma: red triangle; low-gamma: white diamond; beta: brown crescent; mu: purple circle).
Recent motor and somatosensory activation studies, conducted by EGI scientists and performed with both HD EEG and fMRI, show that when accurate head models are employed, there is good correspondence between blood oxygen level dependent (BOLD) activity and EEG spectral changes (before actual finger movement, see Figure 1). As can be seen in Figure 1, the majority of spectral related changes are localized to the primary motor cortex of the hand region (green area), similar to the peak BOLD location.
Left: peak source activity for EEG P50 component from lateral and front views. Right: Peak BOLD response from lateral and front views.
For the somatosensory cortex, activity approximately 50 ms after stimulation of the thumb (same digit used for the motor study in Figure 1) is clearly localized to the anterior and posterior banks of the central sulcus (Figure 2) at the level of primary motor and somatosensory cortex (yellow area in Figure 1). The HD EEG findings are consistent with anatomical evidence: inputs from the somatosensory nucleus of the thalamus project to the sulcal banks of the primary somatosensory cortex (Kass 1993) and somatosensory responses span both the anterior and posterior banks(Tanji and Wise, 1981). In contrast, the peak BOLD response is in the secondary somatosensory cortex.
Kass, J. H. (1993). The functional organization of somatosensory cortex in primates. Annals of Anatomy, 175, 509-518.
Tanji, J., and Wise, S. P. (1981). Submodality distribution in sensorimotor cortex of the unanesthetized monkey. J Neurophysiol, 45, 467-481.
Contact Us
Contact us


